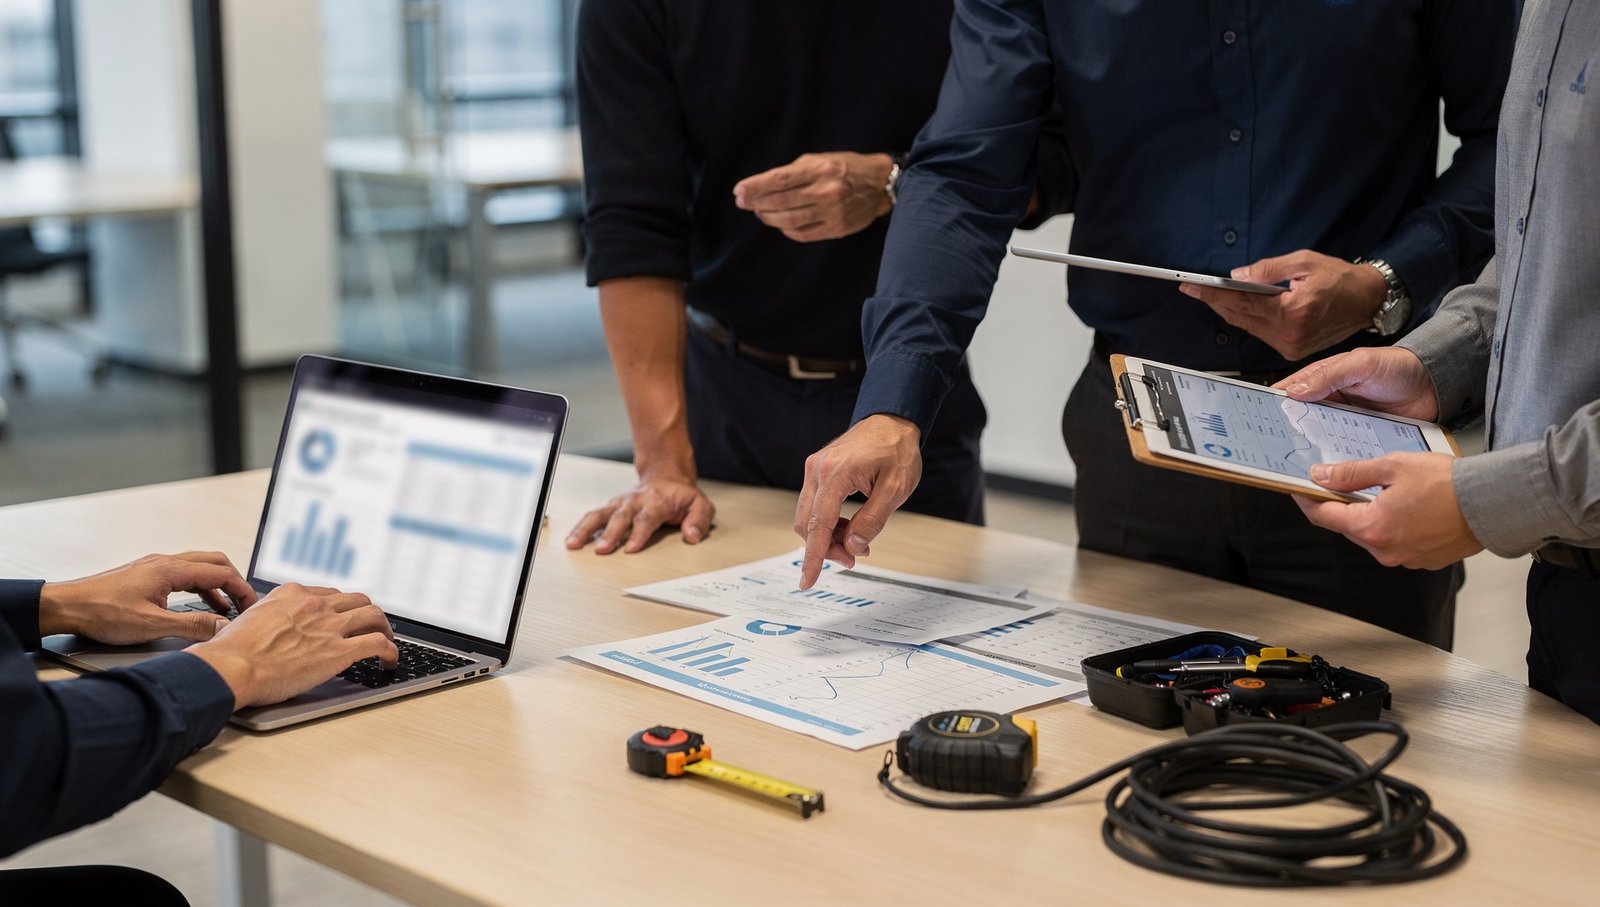
Define the data before building the dashboard
Each work order needs to identify the equipment, category, priority, dates and status. If everyone records an incident differently, the dashboard may show trends that simply reflect changes in data entry.
Agreeing on closure criteria and reasons for waiting is as important as choosing a formula. Also define the period being analyzed and who validates the information.
Indicators to start with
The selection depends on the building. These measures can structure an initial review without assuming that one universal target applies to every facility.
Swipe the table to view all columns →
| Indicator | How to read it | Point to consider |
|---|---|---|
| Preventive maintenance completion | Scheduled tasks completed on time / tasks planned for the period. | Record rescheduling and the reasons for it. |
| Recurring incidents | Repeated failures by equipment or defined cause. | Do not mistake multiple reports of the same event for new failures. |
| Response time | Time until the first action defined in the agreement. | Use the same starting point and priority category. |
| Resolution time | Time until the agreed technical closure. | Distinguish waits for access, authorization or spare parts. |
| Downtime | Time during which a system does not provide its expected service. | Define the function and period being measured. |
| Cost per asset or system | Expenditure recorded under comparable categories. | Separate recurring operations from replacements or improvements. |
Compare equivalent periods
Occupancy, operating hours and demand can change from month to month. If HVAC energy consumption rises, for example, review the context before concluding that maintenance has become less effective.
The scope must also remain consistent. Adding equipment to the inventory may increase the number of tasks or incidents without necessarily indicating a decline in operations.
Turn reports into decisions
A review meeting can focus on deviations, causes and actions. The report should make it possible to identify what changed, which equipment needs attention and which decision requires authorization.
If a preventive task is incomplete because access was unavailable, the appropriate action may be to reorganize the work window. If a failure recurs after several repairs, further diagnosis or an assessment of replacement may be needed.
Avoid indicators without context
An average can conceal very different incidents. Separating priorities and systems helps interpret time measurements. Similarly, counting closed tasks does not demonstrate that important recommendations have been addressed.
URBANARC connects asset management with technical maintenance history to organize this information. The dashboard should support the facility manager and allow its figures to be traced back to the original records.
Frequently asked questions
Which KPIs are best for a building?
Those that support decisions about its priorities. Start with completion, recurrence, times and downtime, then refine the selection according to how the information is used.
Does a lower monthly cost always indicate an improvement?
Not necessarily. It may reflect fewer completed tasks or postponed work. Read it alongside completion, equipment condition and outstanding issues.
Is specialized software required?
What is needed is a consistent, accessible record. The tool should suit the volume and process; a complex system does not fix incomplete data on its own.